
Fructosamine Levels
Understand your blood sugar trends with the Fructosamine Levels Chart. Gain insights into short-term glucose control and optimize diabetes management.

What is a Fructosamine Levels Chart?
The Fructosamine Levels Chart is an essential diagnostic tool in diabetes management. It serves as a visual representation to interpret the results of the Fructosamine test, a blood test that gauges the average glucose levels over a relatively short period, specifically 2-3 weeks. This is in stark contrast to the more commonly known A1C test, which provides insights into blood glucose averages over a more extended period of 2-3 months.
Given the shorter duration that the Fructosamine test covers, it becomes an invaluable tool for healthcare professionals and patients keen on monitoring more immediate changes in blood sugar levels. This immediacy is especially crucial for individuals who have recently adjusted their diabetes medications, made significant dietary changes, or experienced sudden fluctuations in their blood sugar levels for various reasons.
The chart itself is designed to be user-friendly, categorizing Fructosamine test results into distinct ranges. These ranges help determine whether the blood sugar levels have been low, within the target range, or high over the past few weeks. By offering a clear and concise breakdown, the chart aids in demystifying the numerical values of the test, making it easier for patients to understand their current state of blood sugar control.
Furthermore, the Fructosamine Levels Chart holds particular significance for certain individuals who might not be ideal candidates for the A1C test. This includes those with specific hemoglobin variants or conditions that might affect the lifespan of their red blood cells. For such individuals, the chart offers an alternative means to keep a close eye on their blood sugar management.
In the broader context of diabetes care, tools like the Fructosamine Levels Chart play a pivotal role. They not only facilitate better understanding and communication between patients and healthcare providers but also empower patients to take a more active role in managing their condition.
Printable free Fructosamine Levels Chart
Download and access our Fructosamine Levels Chart for free
How does it work?
Our printable Fructosamine Levels Chart is a visual representation designed to simplify interpreting Fructosamine test results. The test itself measures the concentration of fructosamine in the blood, which is a compound formed when glucose binds to proteins, predominantly albumin.
Since albumin has a shorter lifespan than red blood cells, the fructosamine test reflects average blood glucose levels over 2-3 weeks rather than the 2-3 months covered by the A1C test.
This shorter timeframe makes the Fructosamine test particularly valuable in situations where rapid changes in blood glucose levels are expected or when an immediate assessment of glucose control is required. The chart aids in translating the numerical test results into actionable insights, categorizing them into specific ranges that signify whether the glucose control is within target, above, or below the desired levels.
- Acquisition of Test Results: Begin by obtaining the Fructosamine test result, typically provided in a laboratory report.
- Reference the Chart: With the test result in hand, refer to the Fructosamine Levels Chart.
- Matching and Interpretation: Match the obtained test result to the corresponding range provided on the chart. This will indicate whether the average blood glucose levels over the past 2-3 weeks have been within the normal range, elevated, or lower than desired.
- Comprehensive Understanding: While the chart provides a quick overview, it's essential to interpret the results in the context of individual health conditions, medications, and other relevant factors.
- Consultation: Always consult with a healthcare provider to gain a deeper understanding of the results. They can provide insights into the potential causes of deviations from the target range and recommend adjustments to diabetes management strategies if needed.
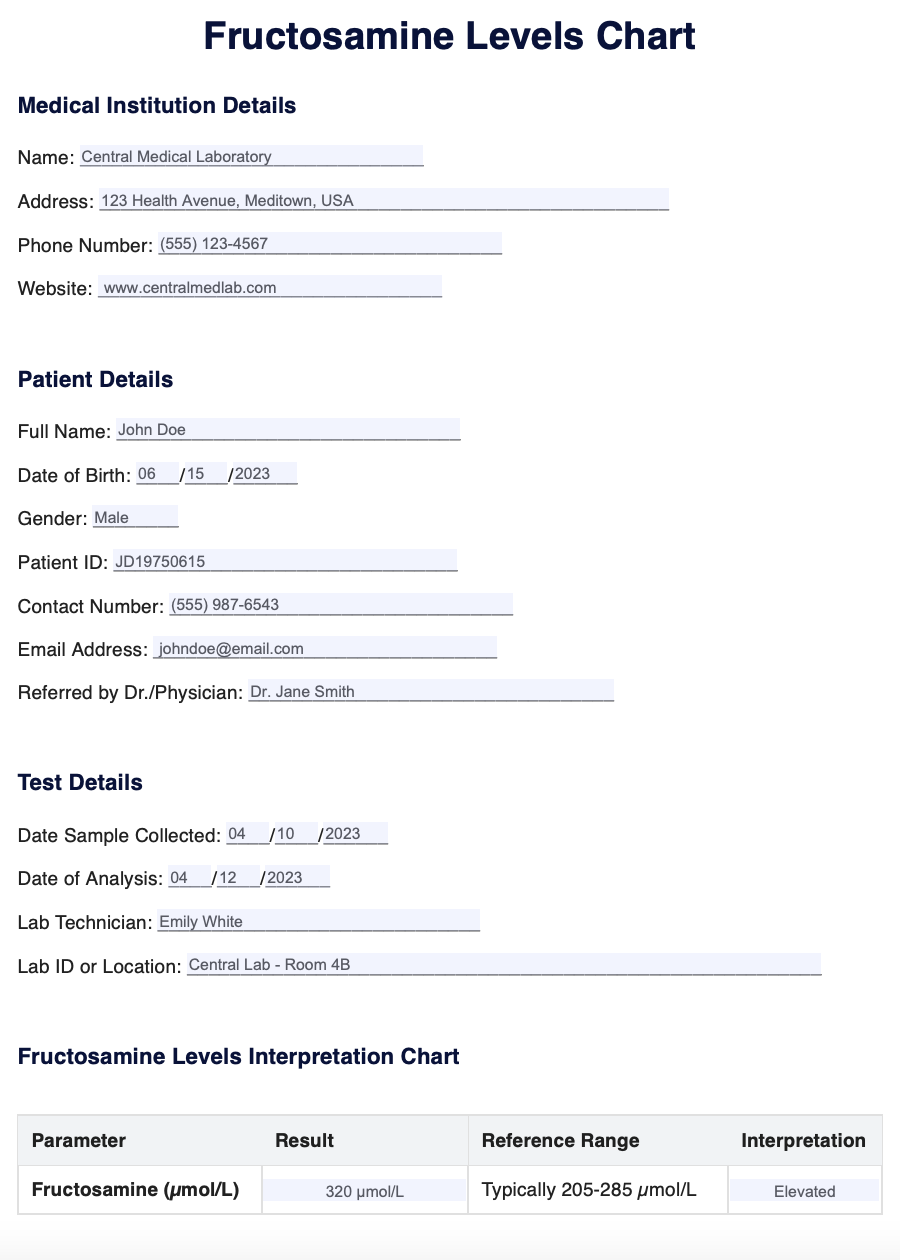
Fructosamine Levels Chart Example (sample)
The Fructosamine Levels Chart PDF is a visual guide to help individuals and healthcare professionals interpret Fructosamine test results. For a clearer understanding, let's consider a few examples:
- Example 1: An individual's test result shows a Fructosamine level of 250 µmol/L. Upon referencing the Fructosamine Levels Chart, this value is within the 'normal' range for most adults. This suggests that the person's average blood sugar levels have been relatively stable over the past 2-3 weeks.
- Example 2: Another individual has a Fructosamine level of 350 µmol/L. When matched with the chart, this value falls into a higher range, indicating elevated average blood sugar levels during the previous 2-3 weeks. Such a result may signal the need for further evaluation, closer glucose monitoring, or potential adjustments in diabetes management.
Download our Fructosamine Levels Chart PDF here for free
When would you use this Chart?
The Fructosamine Levels Chart is an invaluable tool for understanding and interpreting short-term blood sugar control. Its application spans various scenarios and is beneficial for multiple stakeholders. Here are some of the primary instances when the chart proves to be essential:
- For Diabetes Management: Individuals diagnosed with diabetes can use the chart to gain insights into their blood sugar control over the past 2-3 weeks. It offers a more immediate view than the A1C test, allowing patients to see the impact of recent changes in their diet, medication, or lifestyle.
- Healthcare Professionals: Doctors, endocrinologists, and other healthcare providers often refer to the Fructosamine Levels Chart when assessing the effectiveness of newly prescribed diabetes medications or alterations in treatment plans. It aids them in making informed decisions about further interventions.
- Special Medical Conditions: For patients with conditions that can interfere with the A1C test, such as certain anemias or hemoglobinopathies, the Fructosamine test and its corresponding chart become especially crucial. It provides an alternative method to gauge blood sugar control without the influence of these conditions.
- Rapid Blood Sugar Fluctuations: In situations where individuals experience sudden and significant changes in their blood sugar levels—perhaps due to stress, illness, changes in medication, or other factors—the chart can be instrumental. It helps quickly gauge the average blood sugar levels, enabling timely interventions.
- Educational Purposes: The chart is also a valuable educational tool. Diabetes educators and nutritionists might use it to explain the concept of blood sugar control to newly diagnosed patients, helping them understand the importance of consistent management.
The Fructosamine Levels Chart serves as a bridge between raw test results and actionable insights, guiding individuals and professionals in making informed decisions about diabetes care.
What do the results mean?
Fructosamine levels are a window into the average blood sugar levels over a relatively short period, typically the past 2-3 weeks. These levels indicate how well blood sugar has been managed during this timeframe. Interpreting the results can provide valuable insights into the effectiveness of current diabetes management strategies and whether any adjustments are needed.
- Normal Range: A Fructosamine result within the standard reference range suggests that blood sugar levels have been relatively stable and well-controlled over the past few weeks. This indicates that the current diabetes management plan, including medications, diet, and lifestyle choices, is effective.
- Elevated Levels: If the Fructosamine levels are higher than the typical range, it suggests that the average blood sugar levels have been elevated during the assessed period. Elevated levels might indicate that the current diabetes management approach isn't as effective as it should be. It could also indicate recent stressors, dietary changes, or other factors temporarily affecting blood sugar control.
- Below Normal Levels: While less common, Fructosamine levels lower than the standard range might indicate frequent episodes of low blood sugar (hypoglycemia). This could be a result of overly aggressive diabetes treatment or other factors that need to be addressed.
It's crucial to remember that while our Free Fructosamine Levels Chart offers valuable insights, it is just one piece of the puzzle. Individual factors, such as age, overall health, and specific medical conditions, can influence the results. Therefore, it's imperative to consult with a healthcare provider to understand the full context of the results and determine the best course of action moving forward.
Research & Evidence
The Fructosamine test, since its inception, has filled a significant gap in the realm of diabetes management. While the A1C test remains the gold standard for assessing long-term glucose control, the Fructosamine test has emerged as a reliable alternative for gauging short-term glucose levels, especially when the A1C might be misleading or not applicable.
Research has consistently shown the efficacy of the Fructosamine test in reflecting average blood glucose levels over a 2-3 week period. This is attributed to the fact that fructosamine forms when glucose binds to proteins, primarily albumin, in the blood. Since the half-life of albumin is approximately 20 days, the test effectively captures the average glucose levels over this span (Cohen, et al., 1987).
The Fructosamine Levels Chart has been developed to aid in interpreting the test results. By providing a visual representation and correlating fructosamine levels with average glucose concentrations, the chart has become an indispensable tool for both patients and healthcare providers. It not only simplifies the understanding of the results but also facilitates informed decision-making regarding diabetes management (Armbruster, 1987).
However, it's essential to note that while the Fructosamine test and the accompanying chart are valuable, they should be used with other diagnostic tools and clinical assessments for a comprehensive understanding of an individual's glucose control.
Commonly asked questions

Healthcare providers, especially endocrinologists and primary care doctors, often request this chart for patients with diabetes or those suspected of having blood sugar abnormalities.
When there's a need to monitor short-term changes in blood sugar, especially after treatment adjustments or in situations where A1C testing isn't suitable.
The chart is used to interpret the results of the Fructosamine test, providing a visual representation of blood sugar levels in the normal range.
Interpreting the chart is quick, usually taking only a few minutes once the Fructosamine test results are available.
Why use Carepatron as your Fructosamine Levels app?
Navigating the complexities of healthcare requires robust and user-friendly digital solutions. Carepatron emerges as a frontrunner, especially when interpreting and managing Fructosamine Levels. Here's why Carepatron should be your first choice:
- User-Centric Design: Carepatron's general practice software is meticulously designed to prioritize user experience. Its intuitive interface ensures that patients and healthcare providers can effortlessly access and interpret Fructosamine Levels, streamlining the entire process.
- Unparalleled Data Security: In an era where data breaches are rampant, Carepatron's commitment to data privacy is unwavering. Adhering to global standards like HIPAA, GDPR, and HITRUST, the healthcare compliance software ensures that your sensitive health data is always safeguarded.
- Collaboration Made Easy: With features embedded in the platform , Carepatron fosters seamless collaboration. Whether it's sharing results, consulting peers, or updating patients, real-time communication is just a click away.
- Holistic Patient Management: Beyond Fructosamine Levels, Carepatron's electronic patient records offer a comprehensive view of a patient's health metrics, ensuring holistic patient management.
- Global Recognition: Carepatron's telehealth platform and other offerings are trusted by a global community of healthcare professionals, underscoring its reliability and effectiveness.
- Simplicity at its Best: Carepatron eliminates the steep learning curve often associated with healthcare software. Its practice management software is designed for simplicity, ensuring that healthcare providers can direct their focus where it's needed most - patient care.
For those searching for a reliable, efficient, and user-centric platform for Fructosamine Levels management, Carepatron stands out as the gold standard. Its innovative features, stringent compliance measures, and focus on user experience make it the preferred Fructosamine Levels Chart app and Fructosamine Levels Chart Software.

References
Armbruster, D. A. (1987). Fructosamine: structure, analysis, and clinical usefulness. Clinical Chemistry, 33(12), 2153-2163.
Cohen, R. M., Franco, R. S., Khera, P. K., Smith, E. P., Lindsell, C. J., Ciraolo, P. J., ... & Joiner, C. H. (2008). Red cell life span heterogeneity in hematologically normal people is sufficient to alter HbA1c. Blood, 112(10), 4284-4291.
.jpg)
Related Templates
